

前言
上一节实现了车道线的识别,以及设计了算法获取车道线位置,这里参考:项目地址的算法思想,做了一些改动设计的车道线拟合。
算法思想
首先通过上一节的实现我们得到了下图样式的车道线:
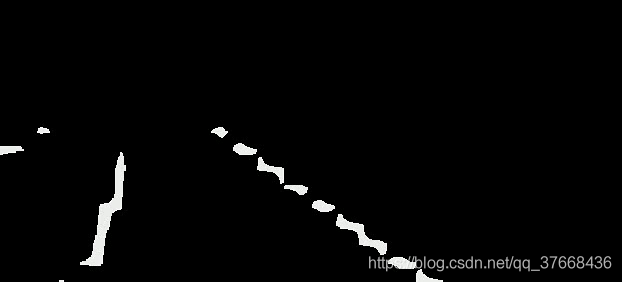
因此我们编写的车道线拟合函数的输入自然就是这张图。
首先记录下不考虑连续帧的情况的算法思想:
首先对图像做对半的分割
理想的车道线是左线和右线,然后在我们图像的左右两部分,分割代码:
midpoint = np.int(img.shape[1]/2)
滑动窗口从下网上检索车道线
原理就是下图:
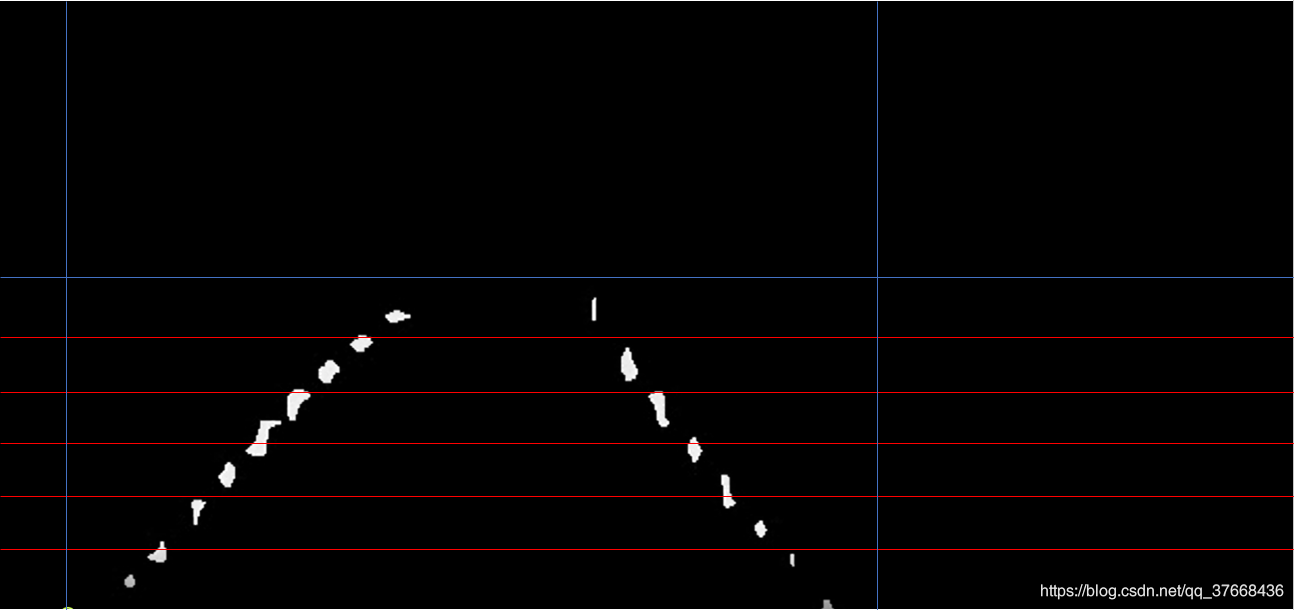
我这里将整张图竖直上分成9块,分别计算每一块的直方图:
h = [0,img.shape[0]]
w = [0,img.shape[1]]
for window in range(nwindows):
    start = h[1] - int(h[0] + (h[1] - h[0]) * window / nwindows)
    end = h[1] - int(h[0] + (h[1] - h[0]) * (window + 1) / nwindows)
    histogram = np.sum(img[end:start,w[0]:w[1]], axis=0)
效果(这张图是将每块的直方图都画在一张图上了):
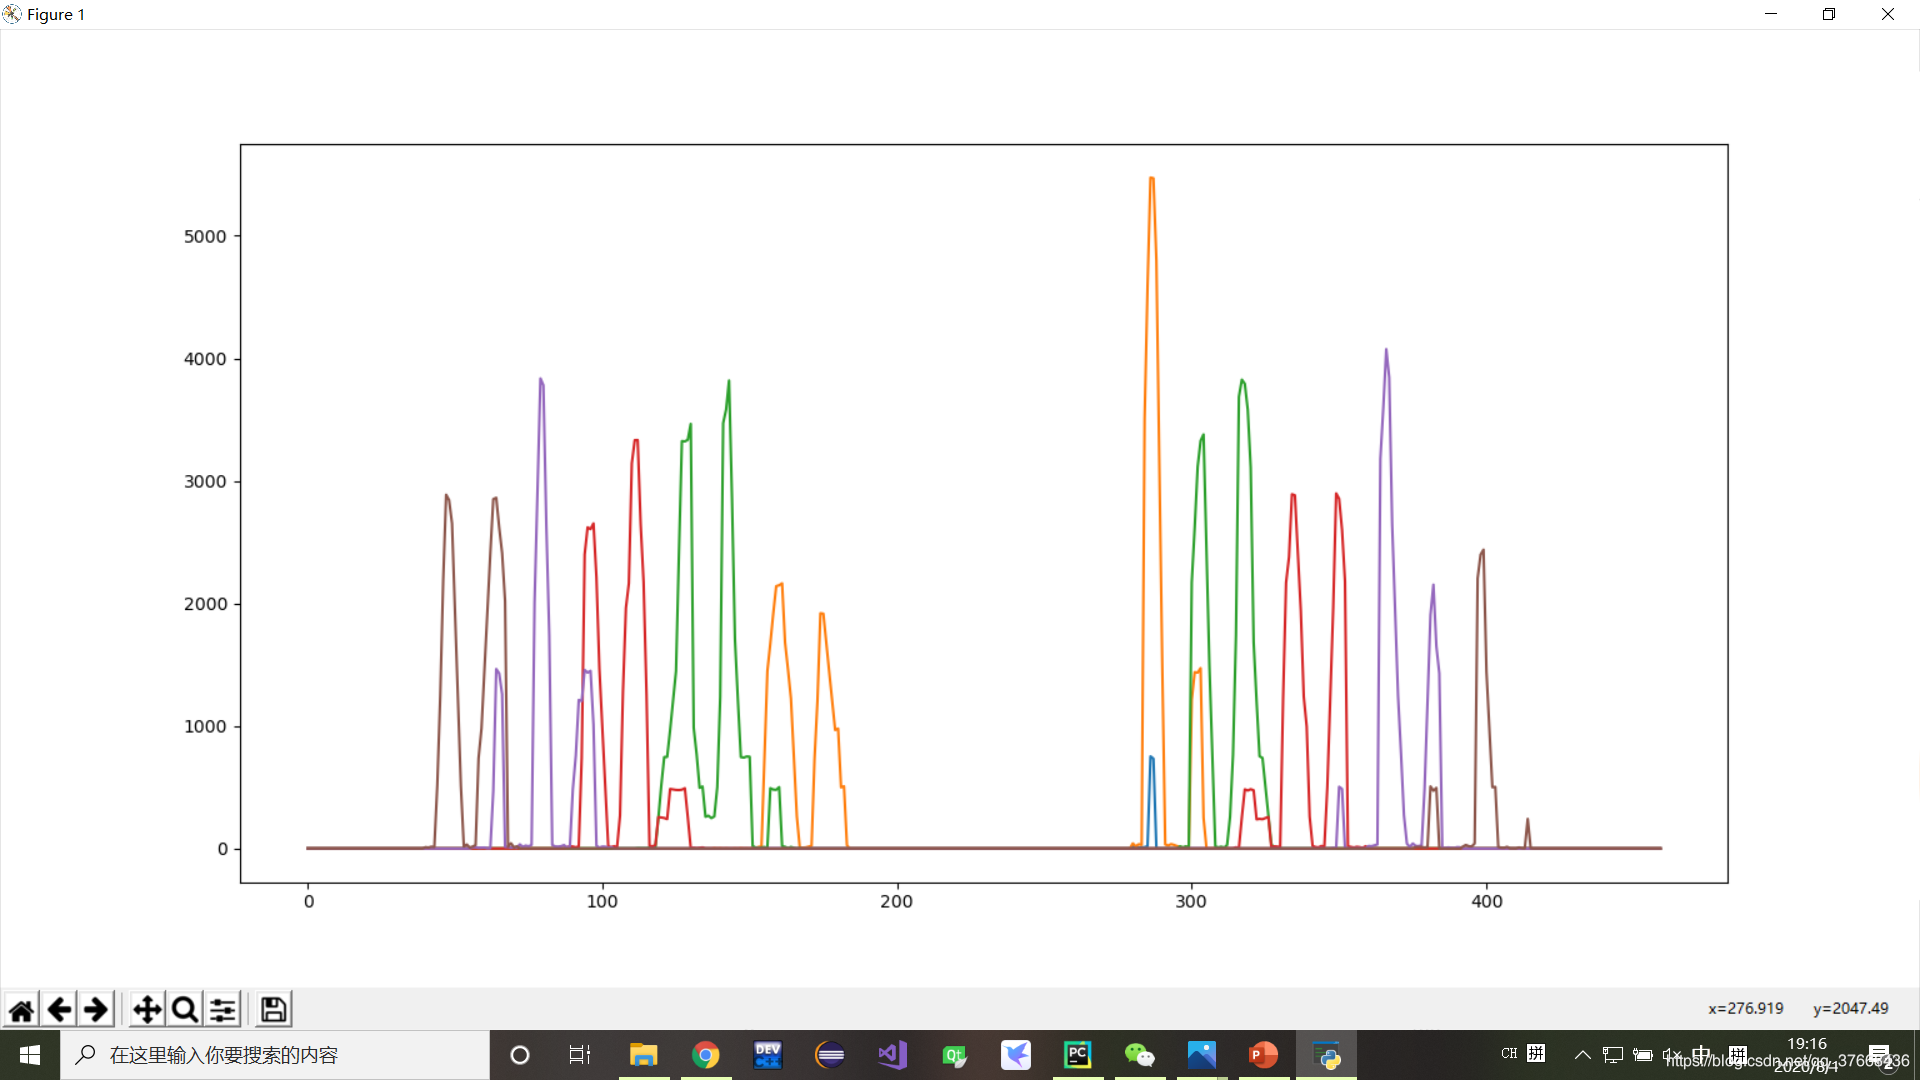
从最底下找左右车道的参考点
这个参考点就是车道的大致位置,参考点比较好找使用numpy的argmax函数就能找到峰值,基本就是车道大致位置,这里我设了一个阈值minlane,如果峰值小于这个阈值表示不能作为参考基准,而采用上一次的基准:
leftx_current = np.argmax(histogram[:midpoint]) if np.argmax(histogram[:midpoint]) > minLane else leftx_current
rightx_current = np.argmax(histogram[midpoint:]) + midpoint if np.argmax(histogram[midpoint:]) > minLane else rightx_current
找基准点附近的车道点根据基准设置宽100的矩形框,框内的白色就是车道线的点:
 win_y_low = img.shape[0] - (window+1)*window_height
 win_y_high = img.shape[0] - window*window_height
 win_xleft_low = leftx_current - margin
 win_xleft_high = leftx_current + margin
 win_xright_low = rightx_current - margin
 win_xright_high = rightx_current + margin
cv2.rectangle(out_img,(win_xleft_low,win_y_low),(win_xleft_high,win_y_high),
(0,255,0), 2)
cv2.rectangle(out_img,(win_xright_low,win_y_low),(win_xright_high,win_y_high),
(0,255,0), 2)
使用nonezero函数挑出所有的白色点
good_left_inds = ((nonzeroy >= win_y_low) & (nonzeroy < win_y_high) &
(nonzerox >= win_xleft_low) &  (nonzerox < win_xleft_high)).nonzero()[0]
good_right_inds = ((nonzeroy >= win_y_low) & (nonzeroy < win_y_high) &
(nonzerox >= win_xright_low) &  (nonzerox < win_xright_high)).nonzero()[0]
拟合二阶曲线
left_fit = np.polyfit(lefty, leftx, 2)
right_fit = np.polyfit(righty, rightx, 2)
完整代码
def find_line_fit(img, name = "default" ,nwindows=9, margin=50, minpix=50 , minLane = 50):
    # Find the peak of the left and right halves of the histogram
    # These will be the starting point for the left and right lines
    midpoint = np.int(img.shape[1]/2)
    # Set height of windows
    window_height = np.int(img.shape[0]/nwindows)
    # Identify the x and y positions of all nonzero pixels in the image
    nonzero = img.nonzero()
    nonzeroy = np.array(nonzero[0])
    nonzerox = np.array(nonzero[1])

    # Create empty lists to receive left and right lane pixel indices
    left_lane_inds = []
    right_lane_inds = []
    h = [0,img.shape[0]]
    w = [0,img.shape[1]]
    leftx_current = w[0]
    rightx_current = w[1]
    # Step through the windows one by one
    for window in range(nwindows):
        start = h[1] - int(h[0] + (h[1] - h[0]) * window / nwindows)
        end = h[1] - int(h[0] + (h[1] - h[0]) * (window + 1) / nwindows)
        histogram = np.sum(img[end:start,w[0]:w[1]], axis=0)

        leftx_current = np.argmax(histogram[:midpoint]) if np.argmax(histogram[:midpoint]) > minLane else leftx_current
        rightx_current = np.argmax(histogram[midpoint:]) + midpoint if np.argmax(histogram[midpoint:]) > minLane else rightx_current

        # Identify window boundaries in x and y (and right and left)
        win_y_low = img.shape[0] - (window+1)*window_height
        win_y_high = img.shape[0] - window*window_height
        win_xleft_low = leftx_current - margin
        win_xleft_high = leftx_current + margin
        win_xright_low = rightx_current - margin
        win_xright_high = rightx_current + margin
        # Draw the windows on the visualization image
        # cv2.rectangle(out_img,(win_xleft_low,win_y_low),(win_xleft_high,win_y_high),
        # (0,255,0), 2)
        # cv2.rectangle(out_img,(win_xright_low,win_y_low),(win_xright_high,win_y_high),
        # (0,255,0), 2)
        #
        # cv2.line(out_img,(leftx_current,0),(leftx_current,img.shape[1]),(255,0,0))
        # cv2.line(out_img, (rightx_current, 0), (rightx_current, img.shape[1]), (255, 0, 0))
        # cv2.line(out_img, (midpoint, 0), (midpoint, img.shape[1]), (255, 0, 0))
        #
        # cv2.imshow("rec",out_img)
        # cv2.waitKey(0)

        # Identify the nonzero pixels in x and y within the window
        good_left_inds = ((nonzeroy >= win_y_low) & (nonzeroy < win_y_high) &
        (nonzerox >= win_xleft_low) &  (nonzerox < win_xleft_high)).nonzero()[0]
        good_right_inds = ((nonzeroy >= win_y_low) & (nonzeroy < win_y_high) &
        (nonzerox >= win_xright_low) &  (nonzerox < win_xright_high)).nonzero()[0]
        # Append these indices to the lists
        left_lane_inds.append(good_left_inds)
        right_lane_inds.append(good_right_inds)
        # If you found > minpix pixels, recenter next window on their mean position
        if len(good_left_inds) > minpix:
            leftx_current = np.int(np.mean(nonzerox[good_left_inds]))
        if len(good_right_inds) > minpix:
            rightx_current = np.int(np.mean(nonzerox[good_right_inds]))

    # Concatenate the arrays of indices
    left_lane_inds = np.concatenate(left_lane_inds)
    right_lane_inds = np.concatenate(right_lane_inds)

    # Extract left and right line pixel positions
    leftx = nonzerox[left_lane_inds]
    lefty = nonzeroy[left_lane_inds]
    rightx = nonzerox[right_lane_inds]
    righty = nonzeroy[right_lane_inds]

    # Fit a second order polynomial to each
    try:
        left_fit = np.polyfit(lefty, leftx, 2)
        right_fit = np.polyfit(righty, rightx, 2)
    except:
        print("error:" + name)
        return [0,0,0],[0,0,0]

    return left_fit, right_fit
根据输出的曲线拟合公式计算偏差
cropped = img[78:282, 0:450]
gray = cv2.cvtColor(cropped, cv2.COLOR_BGR2GRAY)
left, right = find_line_fit(gray)
bottom_y = int(cropped.shape[0]/2)
bottom_x_left = int(left[0] * (bottom_y ** 2) + left[1] * bottom_y + left[2])
bottom_x_right = int(right[0] * (bottom_y ** 2) + right[1] * bottom_y + right[2])

mid = 200
cv2.line(cropped, (mid, 0), (mid,cropped.shape[0]), (0, 0, 255), thickness=10)
cv2.line(cropped,(bottom_x_left,bottom_y),(bottom_x_right,bottom_y),(255,0,0), thickness=10)
cv2.line(cropped, (mid, bottom_y), (int(bottom_x_left / 2 + bottom_x_right / 2), bottom_y), (0, 255, 0),
         thickness=10)
angle = int(bottom_x_left / 2 + bottom_x_right / 2) - mid
处理效果
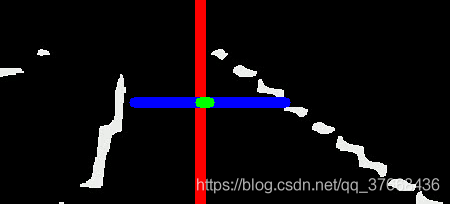
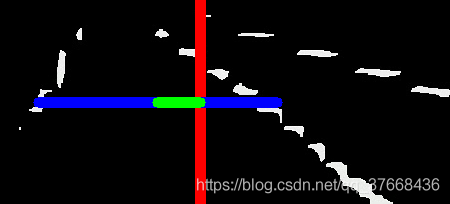
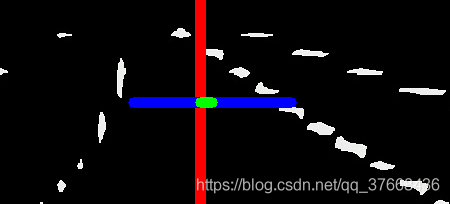
- 红色是我假定的车视场中心
- 蓝色是当前车道的宽以及位置
- 绿色是当前车道中心偏移我的时场中心多少
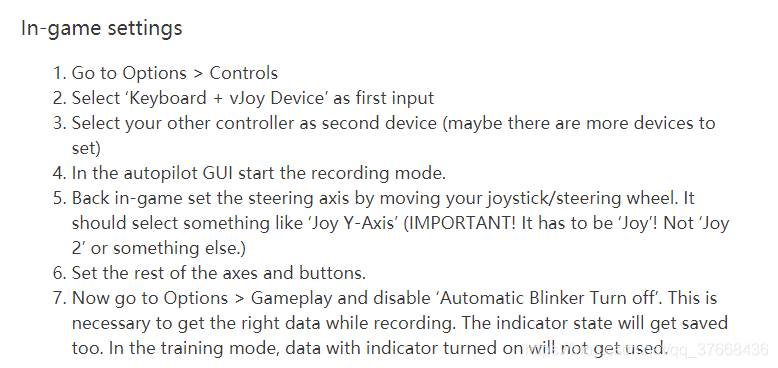
代码控制欧卡2
首先设置欧卡2游戏,参考:参考文档
设置完后,写一个py脚本就可以控制欧卡了:
import pyvjoy
import time
j = pyvjoy.VJoyDevice(1)

def control(angle):
    x = angle /180 + 0.5
    j.data.wAxisX = int(x * 32767)
    j.data.wAxisY = int(0.4 * 32767) # 限制速度,0.4测试了只要你不按键盘的w加速,会定速巡航,按w加速后不再按w也会定速巡航
    j.data.wAxisZ = 0
    j.update()

while True:
    for ang in range(0,180):
        control(ang)
        time.sleep(1)

    for ang in range(-180,0):
        control(ang)
        time.sleep(1)
这段代码的控制方向盘正反转一圈。
最后的测试效果
b站地址
优化
可以说最后的效果一般般,车道线的拟合上存在较大的问题,这也是视觉算法相比于深度学习算法的缺陷所在。
优化方向:
考虑连续帧的车道线的连续性
考虑优化图像做对半的分割,采用上次车道线的中心作为分割
考虑方向控制采用PD控制
采用深度学习的方法推理方向盘打角


评论(0)
您还未登录,请登录后发表或查看评论