

需求
使用matplotlib 绘制折线图 响应鼠标事件 单击折线 线条高亮显示
解决方法: 使用 mplcursors 库, 一句代码可实现.
代码
import matplotlib.pyplot as plt
import mplcursors
import numpy as np
# 生成一些示例数据
x = np.linspace(0, 10, 100)
y = np.sin(x)
# 创建绘图
fig, ax = plt.subplots()
line1, = ax.plot(x, y, label='Sine Wave1')
line2, = ax.plot(x, y+2, label='Sine Wave2')
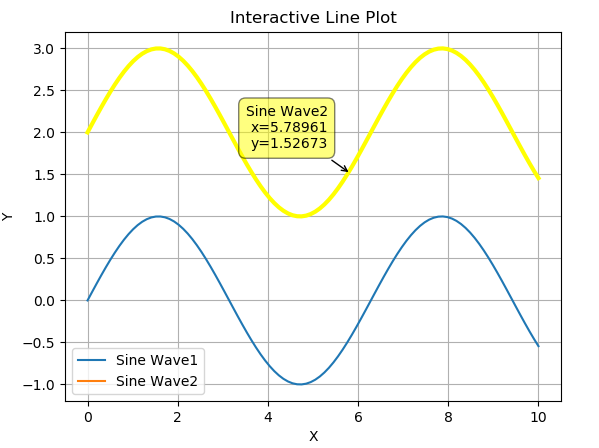
# 点击哪条线段,哪条线段highlight,并显示指定位置的数值
cursor = mplcursors.cursor([line1, line2], highlight=True)
plt.title('Interactive Line Plot')
plt.xlabel('X')
plt.ylabel('Y')
plt.grid(True)
plt.legend()
plt.show()效果
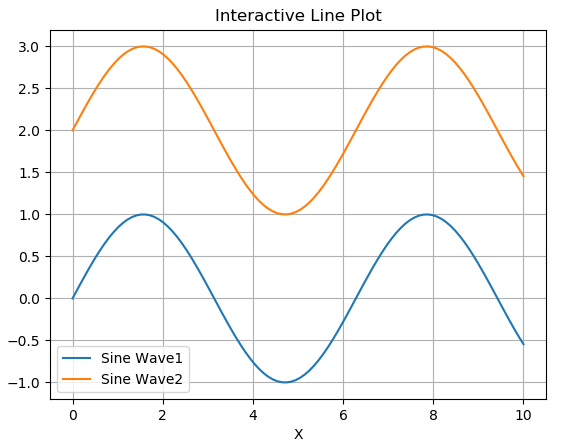
初始效果:
点击Sine Wave2:
点击Sine Wave1:


评论(0)
您还未登录,请登录后发表或查看评论