
from simple_pid import PID
import matplotlib.pyplot as plt
import time
setpoint = 80
controller = PID(1, 0.5, 0.03, setpoint=setpoint, sample_time=None)
fig = plt.figure(figsize=(6, 4))
class object:
def __init__(self):
self.heat = 20
def update(self, input):
self.heat += 3 * input * 0.05
self.heat -= 0.1
obj = object()
x = [0]
y = [obj.heat]
for i in range(300):
output = controller(obj.heat)
time.sleep(0.01)
obj.update(output)
x.append((i + 1) * 0.05)
y.append(obj.heat)
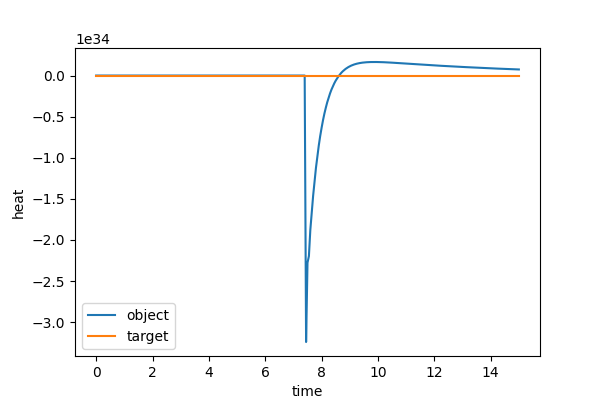
plt.plot(x, y, label='object')
plt.plot(x, [setpoint] * len(x), label='target')
plt.legend()
plt.xlabel('time')
plt.ylabel('heat')
filename = 'pid_process.png'
plt.savefig(filename)
plt.show()
plt.clf()为什么运行代码每次出的结果不一样呢?


第三方账号登入
QQ 微博 微信