

从 Matlab机器人工具箱(3) 开始,使用的机器人工具版本更换到v10版本
他们的区别还是挺大的:
- 一个是单位的问题:从m变为mm
- 还有一个是变量类型的问题,变换矩阵从正常的矩阵形式变为se3类型
所以,这两个版本的代码基本不可以通用
如果网上的代码报错,很可能是因为版本错误
主要修改的地方就是长度的单位,和旋转矩阵每个元素的获取方式
v10版本元素获取可以参考c++的类方法,比如T.t,就是获取旋转矩阵第四列的前三个元素
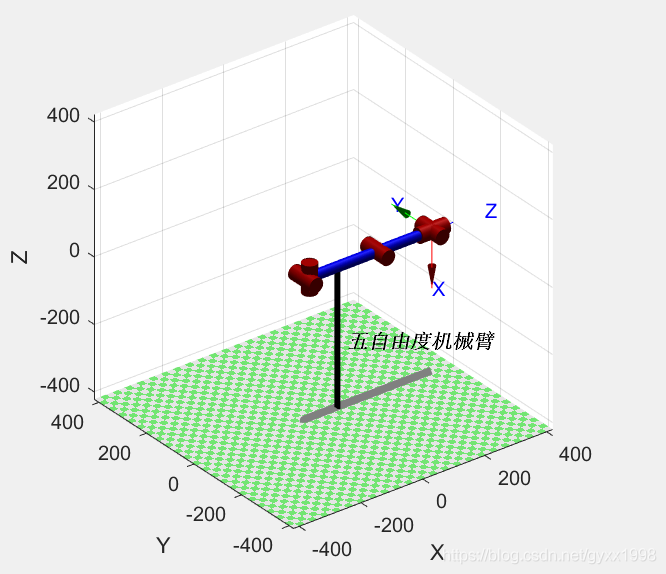
01 先是自己写的五自由度模型建立
下面是自己建立的一个五自由度机械臂
因为是空中机械臂,所以左右和地面时颠倒的
%% 左机械臂(图中右)
d1=[ 0, 0, 0, 0, 0];
a2=[ 0, 13, 233.24, 175.64, 0];
alpha2=[ 0, pi/2, 0, 0, pi/2];
%使用offset
L1(1)=Link('d',d1(1),'a',a2(1),'alpha',alpha2(1),'modified');
L1(2)=Link('d',d1(2),'a',a2(2),'alpha',alpha2(2),'offset',pi/2,'modified');
L1(3)=Link('d',d1(3),'a',a2(3),'alpha',alpha2(3),'modified');
L1(4)=Link('d',d1(4),'a',a2(4),'alpha',alpha2(4),'offset',pi/2,'modified');
L1(5)=Link('d',d1(5),'a',a2(5),'alpha',alpha2(5),'modified');
du=pi/180;
%定义关节范围
L1(1).qlim =[-170, 170]*du;
L1(2).qlim =[60-70, 60+70]*du;
L1(3).qlim =[-70-70,-70+70]*du;
L1(4).qlim =[-70,70]*du;
L1(5).qlim =[-170, 170]*du;
%% 右机械臂(图中左)
d2=[ 0, 0, 0, 0, 0];
a2=[ 0, 13, 233.24, 175.64, 0];
alpha2=[ 0, pi/2, 0, 0, pi/2];
%使用offset
L2(1)=Link('d',d2(1),'a',a2(1),'alpha',alpha2(1),'offset',pi,'modified');
L2(2)=Link('d',d2(2),'a',a2(2),'alpha',alpha2(2),'offset',pi/2,'modified');
L2(3)=Link('d',d2(3),'a',a2(3),'alpha',alpha2(3),'modified');
L2(4)=Link('d',d2(4),'a',a2(4),'alpha',alpha2(4),'offset',pi/2,'modified');
L2(5)=Link('d',d2(5),'a',a2(5),'alpha',alpha2(5),'modified');
du=pi/180;
%定义关节范围
L2(1).qlim =[-170, 170]*du;
L2(2).qlim =[60-70, 60+70]*du;
L2(3).qlim =[-70-70,-70+70]*du;
L2(4).qlim =[-70,70]*du;
L2(5).qlim =[-170, 170]*du;
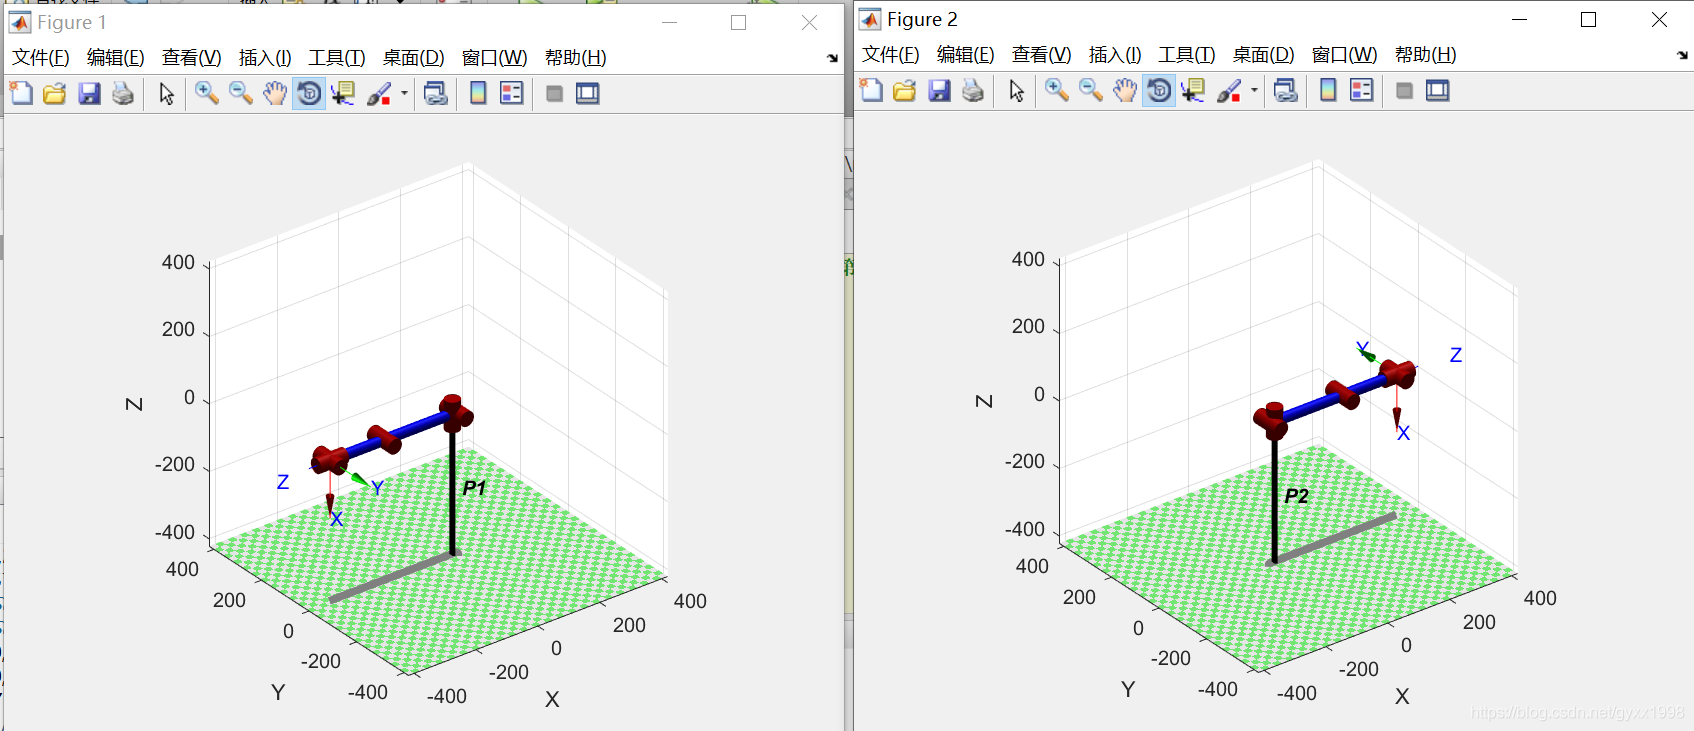
%% 注释部分有错,一画第二个图,第一个图就也改变了
% figure(1)
% 就是下面这里,一定要是不一样的名字呀!
% bot1=SerialLink(L1,'name','五自由度机械臂');
bot1=SerialLink(L1,'name','P1');
bot1.base= transl(45, 0, 0);
bot1.plot([0,pi/2,0,0,0])
figure(2)
% 就是下面这里,一定要是不一样的名字呀!
% bot2=SerialLink(L2,'name','五自由度机械臂');
bot2=SerialLink(L2,'name','P2');
bot2.base= transl(-45, 0, 0);
% bot2.plot([0,pi/2,0,0,0])说明:
- 一开始最后画图的部分有错,只要bot2一使用plot,bot1的图就马上变成bot2的样子(姿态&Base),明明下面那个底座的棍子还是对的呀(呜呜呜~)
- 解决:
后来参考了别人的代码,万万没想到,是关于name的问题,我以为他只是一个中文的标记而已啊
换了name就好了
之后的效果如下图
02 五自由度双臂的工作空间
- 使用蒙特卡洛法
- 一个臂是蓝色点,一个臂是红色点
% RoboticToolbox v10
% 双臂工作空间求解
clc;
clear;
%% 准备
    %保留精度
    format short;

    %角度转换
    du=pi/180;  %度
    radian=180/pi; %弧度

    %模型导入(有offset版)
    mdl_double_arm

%% 参数
    %关节角限位
    q1_s=-170;     q1_end=170;
    q2_s=60-70;    q2_end=60+70;
    q3_s=-70-70;   q3_end=-70+70;
    q4_s=-70;      q4_end=70;
    q5_s=-170;     q5_end=170;


    %计算点数
%     num=10000;
     num=10000;

%% 求取工作空间
    %设置轴关节随机分布,轴5不对工作范围产生影响,设置为0
    q1_rand = q1_s + rand(num,1)*(q1_end - q1_s);
    q2_rand = q2_s + rand(num,1)*(q2_end - q2_s);
    q3_rand = q3_s + rand(num,1)*(q3_end - q3_s);
    q4_rand = q4_s + rand(num,1)*(q4_end - q4_s);
    q5_rand = rand(num,1)*0;
    q = [q1_rand q2_rand q3_rand q4_rand q5_rand]*du;

    %正运动学计算工作空间
    tic;
    %臂1
    T1_cell = cell(num,1);
    for i=1:1:num
        [T1_cell{i}]=bot1.fkine(q(i,:));%正向运动学仿真函数
    end

    %臂2
    T2_cell = cell(num,1);
    for i=1:1:num
        [T2_cell{i}]=bot2.fkine(q(i,:));%正向运动学仿真函数
    end

    disp(['运行时间:',num2str(toc)]);

 %% 分析结果
    %绘制工作空间
    t1=clock;
    figure('name','机械臂工作空间')
    hold on
    plotopt = {'noraise', 'nowrist', 'nojaxes', 'delay',0};

    %绘制机械臂1
    %绘制机械臂位置
    bot1.plot([0 20*du -70*du 20*du 0], plotopt{:});
     figure1_x=zeros(num,1);
     figure1_y=zeros(num,1);
     figure1_z=zeros(num,1);
     for cout=1:1:num
         tt1=T1_cell{cout}.t;%使用机器人工具箱v10,保存为se3格式,而不是矩阵
         figure1_x(cout,1)=tt1(1);
         figure1_y(cout,1)=tt1(2);
         figure1_z(cout,1)=tt1(3);
     end
     plot3(figure1_x,figure1_y,figure1_z,'r.','MarkerSize',3);

     %绘制机械臂2
     %绘制机械臂位置
    bot2.plot([0 20*du -70*du 20*du 0], plotopt{:});
     figure2_x=zeros(num,1);
     figure2_y=zeros(num,1);
     figure2_z=zeros(num,1);
     for cout=1:1:num
         tt2=T2_cell{cout}.t;%使用机器人工具箱v10,保存为se3格式,而不是矩阵
         figure2_x(cout,1)=tt2(1);
         figure2_y(cout,1)=tt2(2);
         figure2_z(cout,1)=tt2(3);
     end
     plot3(figure2_x,figure2_y,figure2_z,'b.','MarkerSize',3);

     hold off
     disp(['绘制工作空间运行时间:',num2str(etime(clock,t1))]);

     %获取X,Y,Z空间坐标范围(y,z二者一样;x去p1的最小,p2的最大)
     Point_range=[min(figure1_x) max(figure2_x) min(figure1_y) max(figure1_y) min(figure1_z) max(figure1_z)];

%% 投影视图
figure('name','三维图')
	plot3(figure1_x,figure1_y,figure1_z,'r.','MarkerSize',4);%设置3有点小
	hold on;
	plot3(figure2_x,figure2_y,figure2_z,'b.','MarkerSize',4);%设置3有点小
	hold off;
	set(gca,'XTick',-500:100:500)%设置坐标刻度
	xlabel('x轴/mm');ylabel('y轴/mm');zlabel('z轴/mm');%先plot再label和view

figure('name','左视图')
	plot3(figure1_x,figure1_y,figure1_z,'r.','MarkerSize',4);
	hold on;
	plot3(figure2_x,figure2_y,figure2_z,'b.','MarkerSize',4);%设置3有点小
	hold off;
	xlabel('x轴/mm');ylabel('y轴/mm');zlabel('z轴/mm');
	view(-90,0);


figure('name','正视图')
	plot3(figure1_x,figure1_y,figure1_z,'r.','MarkerSize',4);
	hold on;
	plot3(figure2_x,figure2_y,figure2_z,'b.','MarkerSize',4);%设置3有点小
	hold off;
	view([0 0]);
	set(gca,'XTick',-500:100:500)
	xlabel('x轴/mm');ylabel('y轴/mm');zlabel('z轴/mm');


figure('name','顶视图')
	plot3(figure1_x,figure1_y,figure1_z,'r.','MarkerSize',4);
	hold on;
	plot3(figure2_x,figure2_y,figure2_z,'b.','MarkerSize',4);%设置3有点小
	hold off;
	xlabel('x轴/mm');ylabel('y轴/mm');zlabel('z轴/mm');
	set(gca,'XTick',-500:100:500)
	view(0, 90);
03 最后是我参考的一个demo
他是用puma560
先是建立模型
然后是轨迹规划
%% 第一个机械臂
mdl_puma560;
p560b = p560; % duplicate the robot
p560b.name ='P1'; % give it a unique name
p560b.base = transl([0 -0.16 0]); % move its base
qr1 = [2.8 0 3.5 0 0 0];
plot(p560, qr1); % display it at ready position
hold on;

%% 第二个机械臂
mdl_puma560;
p560b1 = p560; % duplicate the robot
p560b1.name ='P2'; % give it a unique name
p560b1.base = transl([0 0.16 0]); % move its base
%qr2 = [2.8 0 3.5 0 0 0];
plot(p560, qr1); % display it at ready position
hold on;
%plot(p560b, qr); % display it at ready position
%plot(p560b1, qr); % display it at ready position

%% 轨迹规划部分
t = [0:0.05:5];
%qr11 = [3.8 0 3.5 0 0 0];
qr11 = [4.8 1.5 3.9 1 0 0];
qz1 = qr1;
jt = jtraj(qz1,qr11, t); % trajectory to stretch pose
rx=[];
ry=[];
for q = jt' % for all points on the path
%??hold on
%plot(p560, q');
%??hold on
plot(p560b,q');
plot(p560b1, q');
% X = sprintf('%d and %d',x(6),y(6));
% disp(X)
% rx=[rx;x(6)];
% ry=[ry;y(6)];

end

scatter3(1,1,1);


评论(0)
您还未登录,请登录后发表或查看评论